Anti-Kasha Emissions of Single Molecules in a Plasmonic Nanocavity
Result of the Month
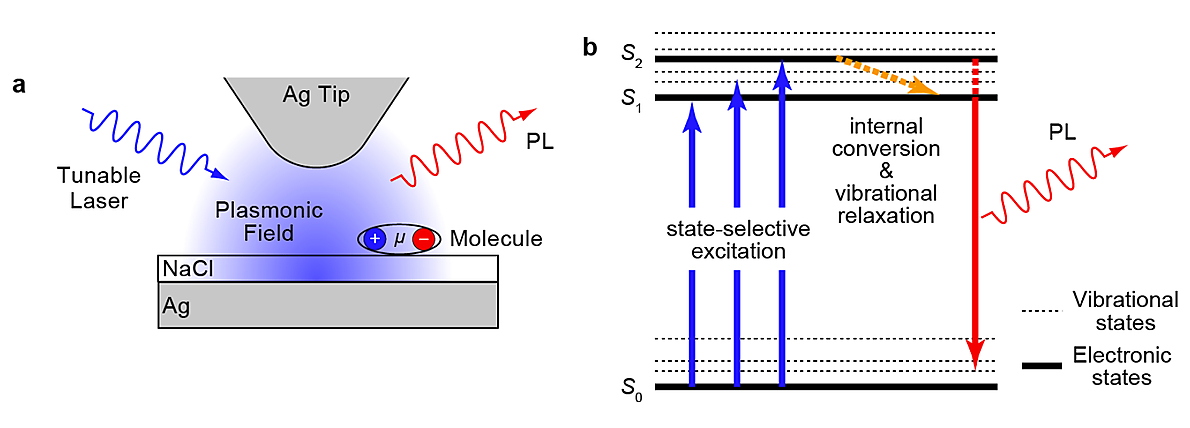
Fig.1. (a) Schematic of single-molecule STM-PL experiment. The measurement system was based on a low-temperature ultrahigh vacuum STM operating at 4.6 K and 5 × 10-11 torr. (b) Energy diagram depicting the excitation, relaxation, and luminescence processes.
In this study, we employ a recently developed STM-photoluminescence (STM-PL) technique with a narrow-line tunable laser16 to investigate anti-Kasha emissions. The experimental setup is shown in Fig. 1(a). The monochromatic and tunable plasmonic field driven by an externally irradiated laser allows state-selective excitation of a single molecule in the plasmonic nanocavity. The PL emission spectra were obtained to reveal the energy relaxation processes initiated from a specific excited state (Fig. 1(b)).
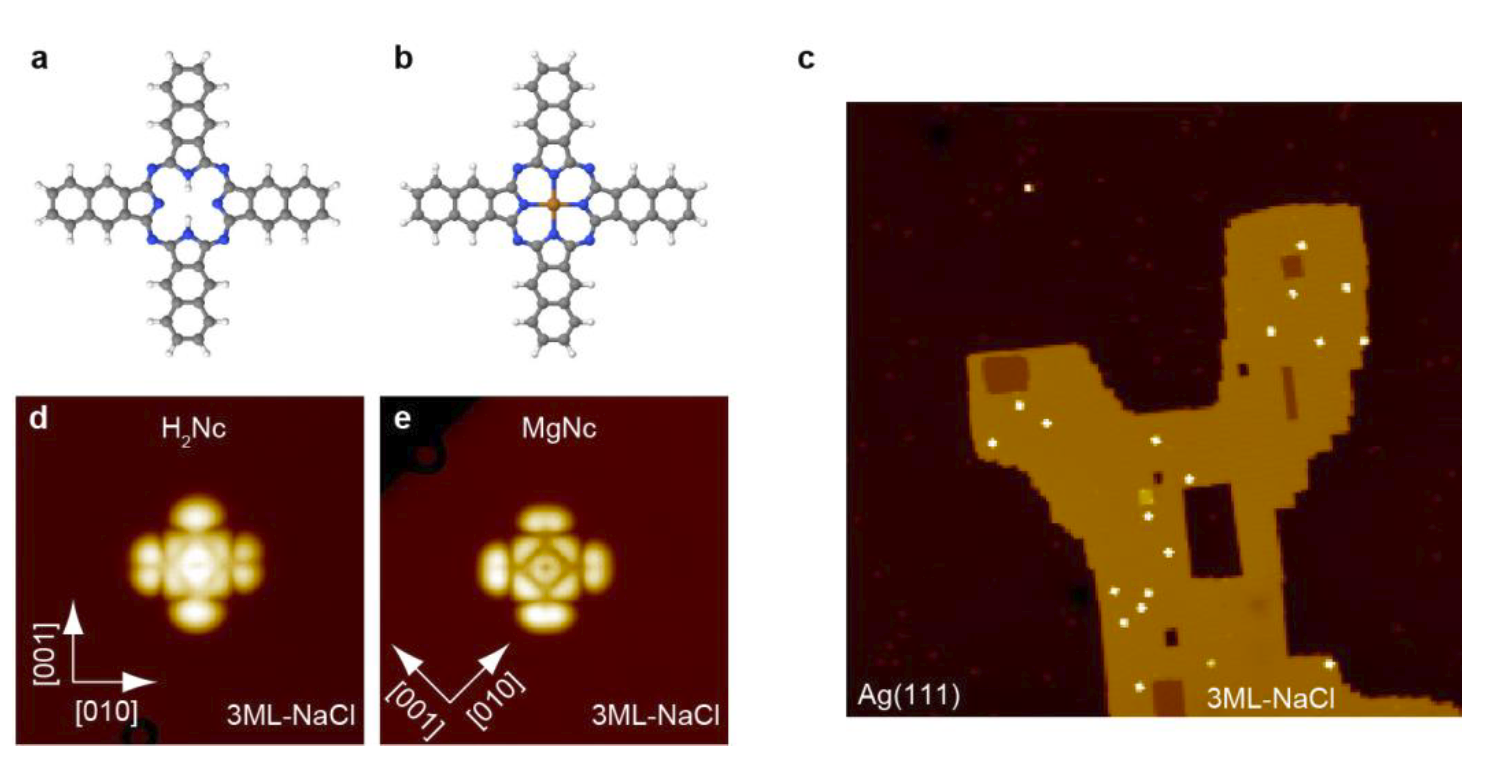
Fig. 2. (a, b) Molecular structure of H2Nc and MgNc, respectively (white: hydrogen, grey: carbon, blue: nitrogen, and red: magnesium). (c) Wide area STM topographic image of the sample (sample bias voltage Vs = 1 V, tunnelling current I = 3 pA, 200 × 200 nm2). (d) Magnified STM image of H2Nc on 3ML-NaCl film on Ag(111) (Vs = 0.8 V, I = 3 pA, 7.5 × 7.5 nm2). (e) Magnified STM image of MgNc on the same substrate (Vs = 0.9 V, I = 3 pA, 7.5 × 7.5 nm2).
Experiment: STM and optical system
All experiments were performed using low-temperature STM (Scienta Omicron), which was operated at 4.6 K under ultrahigh vacuum (UHV). We designed an STM stage that is equipped with two optical lenses for laser illumination and light detection. Each lens covered a solid angle of ~0.5 sr. For the STM-PL measurements, a tunable continuous-wave (CW) laser (Sacher Lasertechnik) was used for excitation. The laser is an external cavity semiconductor diode laser (ECDL) in a Littman/Metcalf configuration with a motorized tuning mechanism, which has a narrow linewidth (<1 MHz corresponding to < 4 neV), and its wavelength can be quickly tuned by the mechanical rotation of a grating in the laser cavity. Two lasers with different tuning ranges of 1.78–1.83 eV (677–695 nm) and 1.59–1.67 eV (744–779 nm) were used. In this study, the laser power was approximately 5–10 Μw and p-polarization was applied.
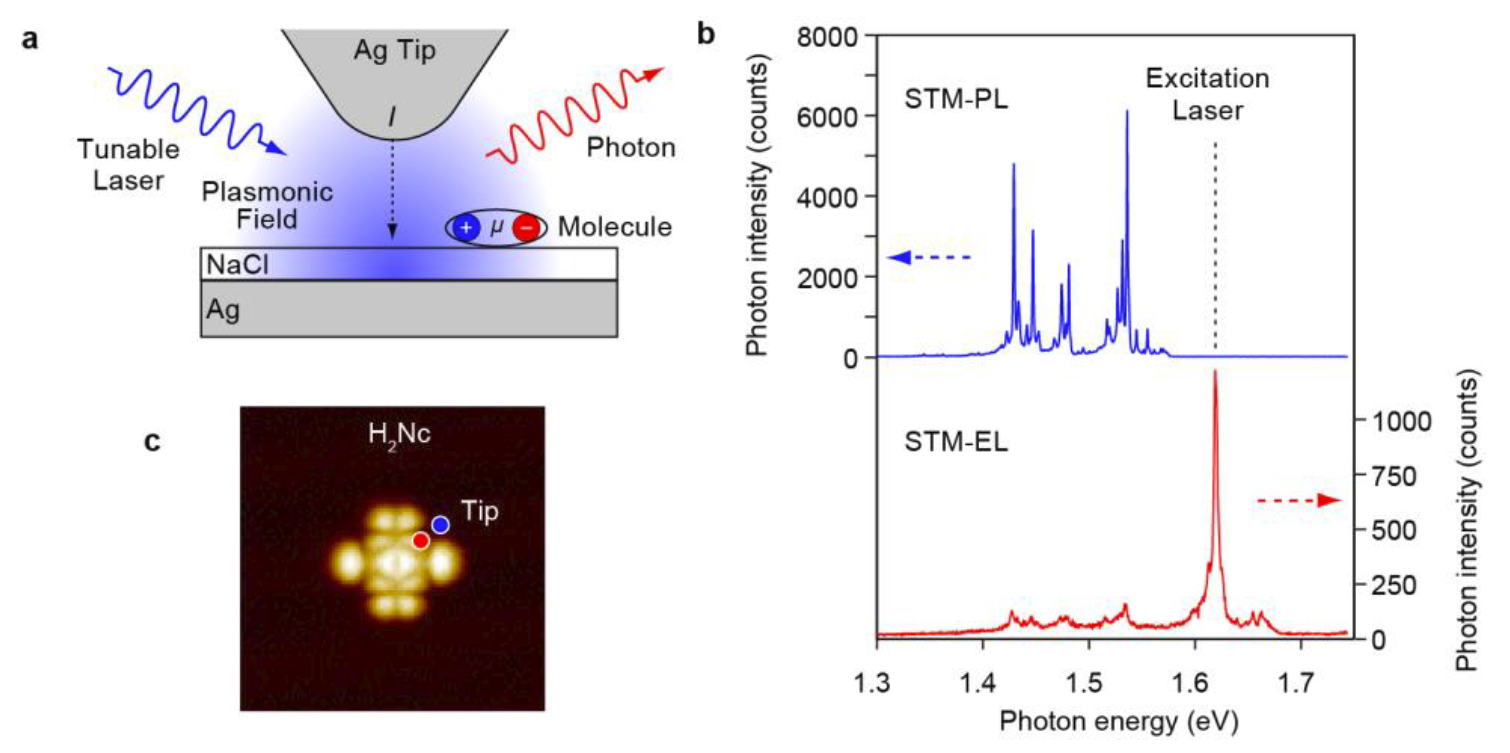
Fig.3. (a) Schematic depiction of STM-EL and STM-PL measurements. For STM-EL, the tunnelling current I of STM was used for excitation, while a plasmonic field driven by a laser was used for STMPL. (b) STM-PL (top) and STM-EL (bottom) spectra of H2Nc on 3ML-NaCl/Ag(111). The measurement conditions for STM-PL: excitation energy Eex = 1.618 eV, laser power = 8.2 μW, Vs = - 2 V, I = 3 pA, and measurement time 1 = s; the measurement was performed at the blue dot in c. For STM-EL: Vs = -2 V, I = 20 pA, measurement time = 60 s; the measurement was performed at the red dot in c. (c) An STM image of H2Nc with tip positions for the spectra shown in b.
---
AUTHORS:
Hiroshi Imada, Miyabi Imai-Imada, Xingmei Ouyang, Atsuya Muranaka, and Yousoo Kim
---
INSTITUTE:
RIKEN, Japan
---
CORRESPONDING AUTHORS:
Yousoo Kim: ykim@riken.jp
---
JOURNAL AND LINK TO PUBLICATION:
AIP The Journal of Chemical Physics : https://aip.scitation.org/journal/jcp
Publication: https://doi.org/10.1063/5.0102087