
PEAK is designed to control acquisition of photoelectron spectra with Scienta Omicron analysers. With its modern software architecture, PEAK offers improved performance for data acquisition, workflow, and live visualisation of data. The modular design and the modern network-based application programming interface (API) facilitate integration of additional equipment as well as full integration of the analyser in external control systems.
The drive to gain a complete descriptive model of materials and reactions, push photoemission spectroscopy experiments to extend into dimensions such as time, space, pressure, and temperature. This causes ever increasing data rates and complexity. At the same time, software standards and architectures have progressed and offer improved support for complex experimental setups and high data rates. With PEAK these advances materialise as efficiency gains and improved workflows, available for Scienta Omicron analysers.
More Information
Graphical User Interface (GUI)

Image Description: The PEAK graphical user interface controls the analyser. Data windows shown can be adapted to the individual preferences. A camera raw monitor is available without any image corrections, as well as a spectrum monitor with image corrections applied. Displaying for example a running average of the data or changing the colour scheme for better visualisation is supported. The analyser control settings are conveniently displayed to the right and easily changed while setting up a measurement. Multiple interfaces can be opened at the same time and displayed across multiple screens.
The PEAK GUI is accessed through standard browsers and uses network communication to control the analyser hardware. Multiple browser tabs of the GUI can be distributed across multiple screens, ensuring all important information for an experiment can be displayed according to individual requirements.
The main view can be configured to show for instance the camera raw monitor directly from the detector without any image processing or corrections applied. A second optional display shows the spectrum monitor. In this view, electron hits from the raw image are processed with either ADC or pulse mode and mapped into the correct spectral channels. The spectrum monitor is continuously updated as more data is accumulated. A convenient feature is to display a running average of accumulated data while fine tuning the analyser parameters. This offers reduced noise and immediate feedback of the attainable data with the currently selected parameters. Each data display can be brought to a dedicated tab by a single click offering an enlarged view of the data.
Data Visualisation

Image Description: Data visualisation is done on the fly and can be applied to a selected slice or the complete data range. The visualised data is continuously updated as the measurement progresses allowing to explore data without interfering with the acquisition.
In PEAK, data visualisation is independent of ongoing acquisitions and is therefore fully flexible. Selecting a specific slice of the multidimensional data is done by defining the axes and ranges to be visualised. One can switch between 1D and 2D representation. It is also possible to zoom in on an interesting region of the displayed data using the mouse. All of this is possible live in the spectrum monitor without interfering with the ongoing acquisition.
For instance, it is possible to display an ongoing deflection scan as a θx, θy image for a selected slice of energy. With the display continuously updating with new data, it is possible to monitor the signal to noise ratio with each consecutive loop over θy deflection and get an early impression of the data. Acquisitions can be stopped directly or after each completed step, for instance after loop is completed or after a spectral region acquisition is finished.
PEAK SDK & API Training
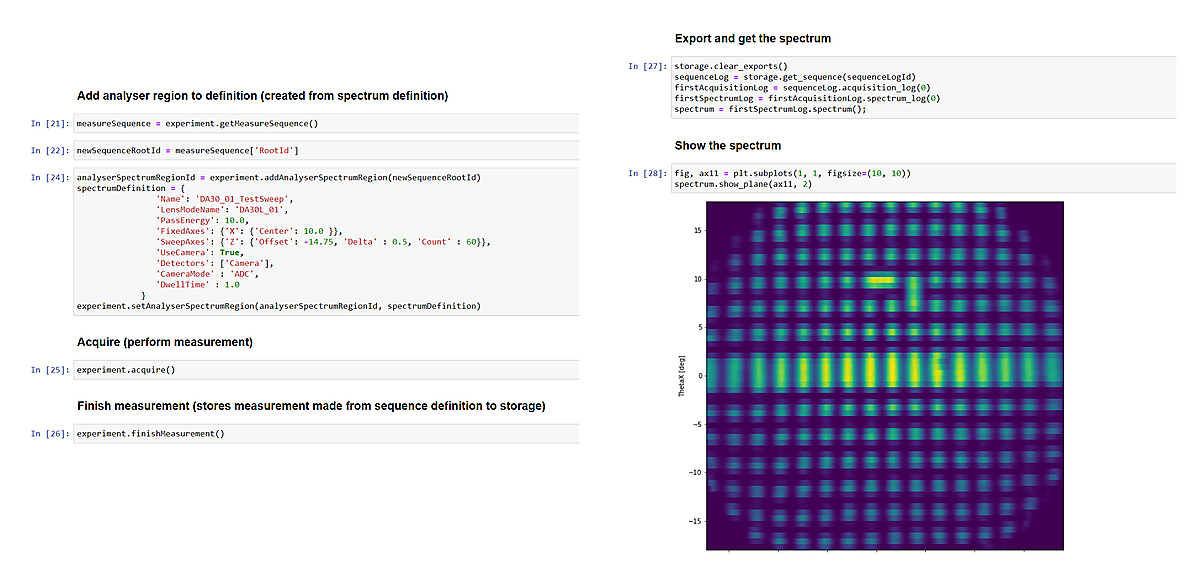
Image Description: Conducting an acquisition using the PEAK API does not require intricate knowledge of all involved servers. It is sufficient to define the spectrum properties and request the acquisition, as shown here with Python.
The PEAK software development kit (SDK) is solely for software development and can by itself not control any hardware. The development environment includes dummy drivers, emulating the various hardware servers, which are controlled through the regular PEAK API. This enables offline development and testing of clients without blocking the analyser hardware from acquiring real measurements. The training course includes an introduction to the architecture, example demonstrations, and exercises for developing clients for the PEAK API. This course is highly recommended when the analyser is to be integrated in an external control system or before writing user drivers.
As the PEAK GUI itself builds on the PEAK API, it is possible for a control system to have the same detail level by addressing the underlying PEAK servers through the API. For low level functionality it is for instance possible to address the camera detector server. For most use cases, it will be far more interesting to focus on higher level functionality provided by the experiment server. It allows an operator to setup and acquire a spectrum region without having to know details of other hardware servers. The acquired data is then returned to the client through the network protocol.
Specifications
- DA30-L, DA20, R4000, R3000
- SES2002, EW4000
- MCP/digital camera
- DLD
- All ethernet standard: HV-rack and CMOS/CCD camera
- PEAK ready Windows 11 Instrument PC
- PEAK-1.7.5 available for download from the Customer Portal.
Downloads
PEAK: Electron Spectroscopy Control and Acquisition Software
PEAK is designed to control acquisition of photoelectron spectra with Scienta Omicron analysers. With its modern software architecture, PEAK offers improved performance for data acquisition, work flow, and live visualisation of data. The modular design and the modern network based application programming interface (API) facilitate integration of additional equipment as well as full integration of the analyser in external control systems.
PEAK Slit Control Upgrade
In photoelectron spectroscopy measurements, there is always a trade-off between signal intensity and resolution. Optimising this balance is the key to obtaining smooth and sharp spectra within the shortest time possible. For hemispherical analysers, this trade-off is controlled by the selected entrance slit and pass energy.
Enhanced ARPES experiments with PEAK at SSRL
The ARPES beamline 5-2 (BL 5-2) in Stanford Synchrotron Radiation Lightsource (SSRL) in the US has been operating for four years after upgrading to a fully integrated control system using PEAK application programming interface (API). The PEAK API is specifically designed for seamless integration of the analyser with external hardware like beamline and manipulator.
