High Speed Dynamic and Operando Experiments
Result of the Month
Thermal Reduction of Titanium Oxides
Reduction Measurements
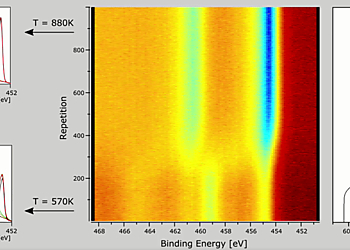
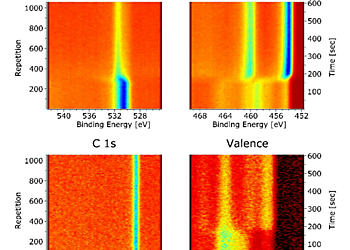
The Titanium surface was analysed by XPS using the new Multi Peak Monitoring mode in order to continuously observe the spectral evolution of O 1s, Ti 2p, C 1s and the valence band (figure 2). After 2 minutes into the data acquisition the temperature was ramped from 550 K to 900 K within ~ 2 min. Each acquisition cycle consisting of the four spectra took ~ 570 ms with 500 ms detection time and was repeated over a period of 10 minutes.
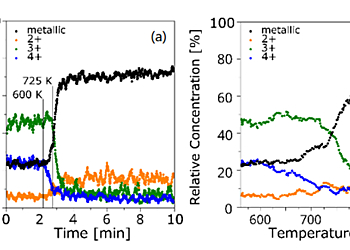
Initially, the Titanium surface shows mixed oxidation states (figure 3a) with contributions from the Ti 4+, 3+, 2+ and the metallic state [1] at binding energies of 458.9 eV, 457.5 eV, 455.3 eV and 454.1 eV. The main peaks can be clearly seen in the colour-coded representation of the Ti 2p interval (figure 2). A strong O 1s peak at binding energy 530.3 eV is observed at the beginning (figure 2) which can be attributed mainly to the Titanium oxides TiO2 and Ti2O3. After the thermal reduction of the 4+ and 3+ oxidic states of Titanium only the metallic 2p doublet is evident (figure 3b). It can be seen from the colour-coded spectra in figure 2 that the O 1s peak is shifted to a higher BE of 531.8 eV, associated with TiO.
The rapid change from pre-dominantly 3+ and 4+ to metallic Titanium when ramping the temperature takes place within < 1 minute and can be seen after 2 minutes of starting the data acquisition (figure 4a). The changes in distribution of the Titanium states is also shown as a function of temperature in figure 4b. The 4+ contribution starts to decrease from ca. 600 K, where all other contributing states increase. From about 725 K the 3+ state starts to decrease with temperature while mainly the contribution from the metallic peak increases. It can be seen that a slower increase of the metallic Ti signal during the 4+ reduction is followed by a faster increase during the 3+ reduction. The redistribution of the Titanium states appears to proceed in a step-wise manner with the reduction of the 3+ state taking place only after the 4+ state has vanished.
As expected, the intensity of the oxygen peak is greatly reduced at the same time (figure 2). Oxidised Titanium shows a higher concentration of the 4+ state at the surface whereas the suboxides are mainly present near the oxide-metal interface and on heating metallic Titanium can diffuse into the oxide overlayer [1]. Due to the observation in ref. [2] desorption of Titanium oxides from the surface does not take place under similar conditions and it can therefore be concluded from the decrease of the 4+ state and the initial increase of the 3+ state that a TiO2 overlayer is first reduced followed by further reduction of 3+. This step-wise redistribution is likely to be accompanied by oxygen desorption and a rearrangement of the surface structure [3].
Name and email of corresponding author:
Christian Kaiser, christian.kaiser@scientaomicron.com
References
- A.F. Carley et al., J. Chem. Soc. Faraday Trans. I 83 (1987), 351
- G. Lu et al., Surface Science 458 (2000), 80
- T. Leichtweiss et al., J. Mater. Chem. A, 2014, 2, 6631


