Surface Chemistry on a Polarizable Surface: Coupling of CO with KTaO3(001)
Result of the Month
 | © American Association for the Advancement of Science")
CO adsorption on bulk-terminated KTaO3(001).
In this work, we use carbon monoxide to probe whether and how ferroelectric lattice distortions couple to adsorbates. Combined atomic force microscopy/scanning tunneling microscopy (AFM/STM) is used to identify the adsorption configurations of CO, temperature-programmed desorption (TPD) determines the desorption kinetics and energies, and density functional theory (DFT) calculations provide insights into the coupling with ferroelectric lattice distortions. This altogether identifies the key processes that dictate the surface chemistry on polarizable materials.
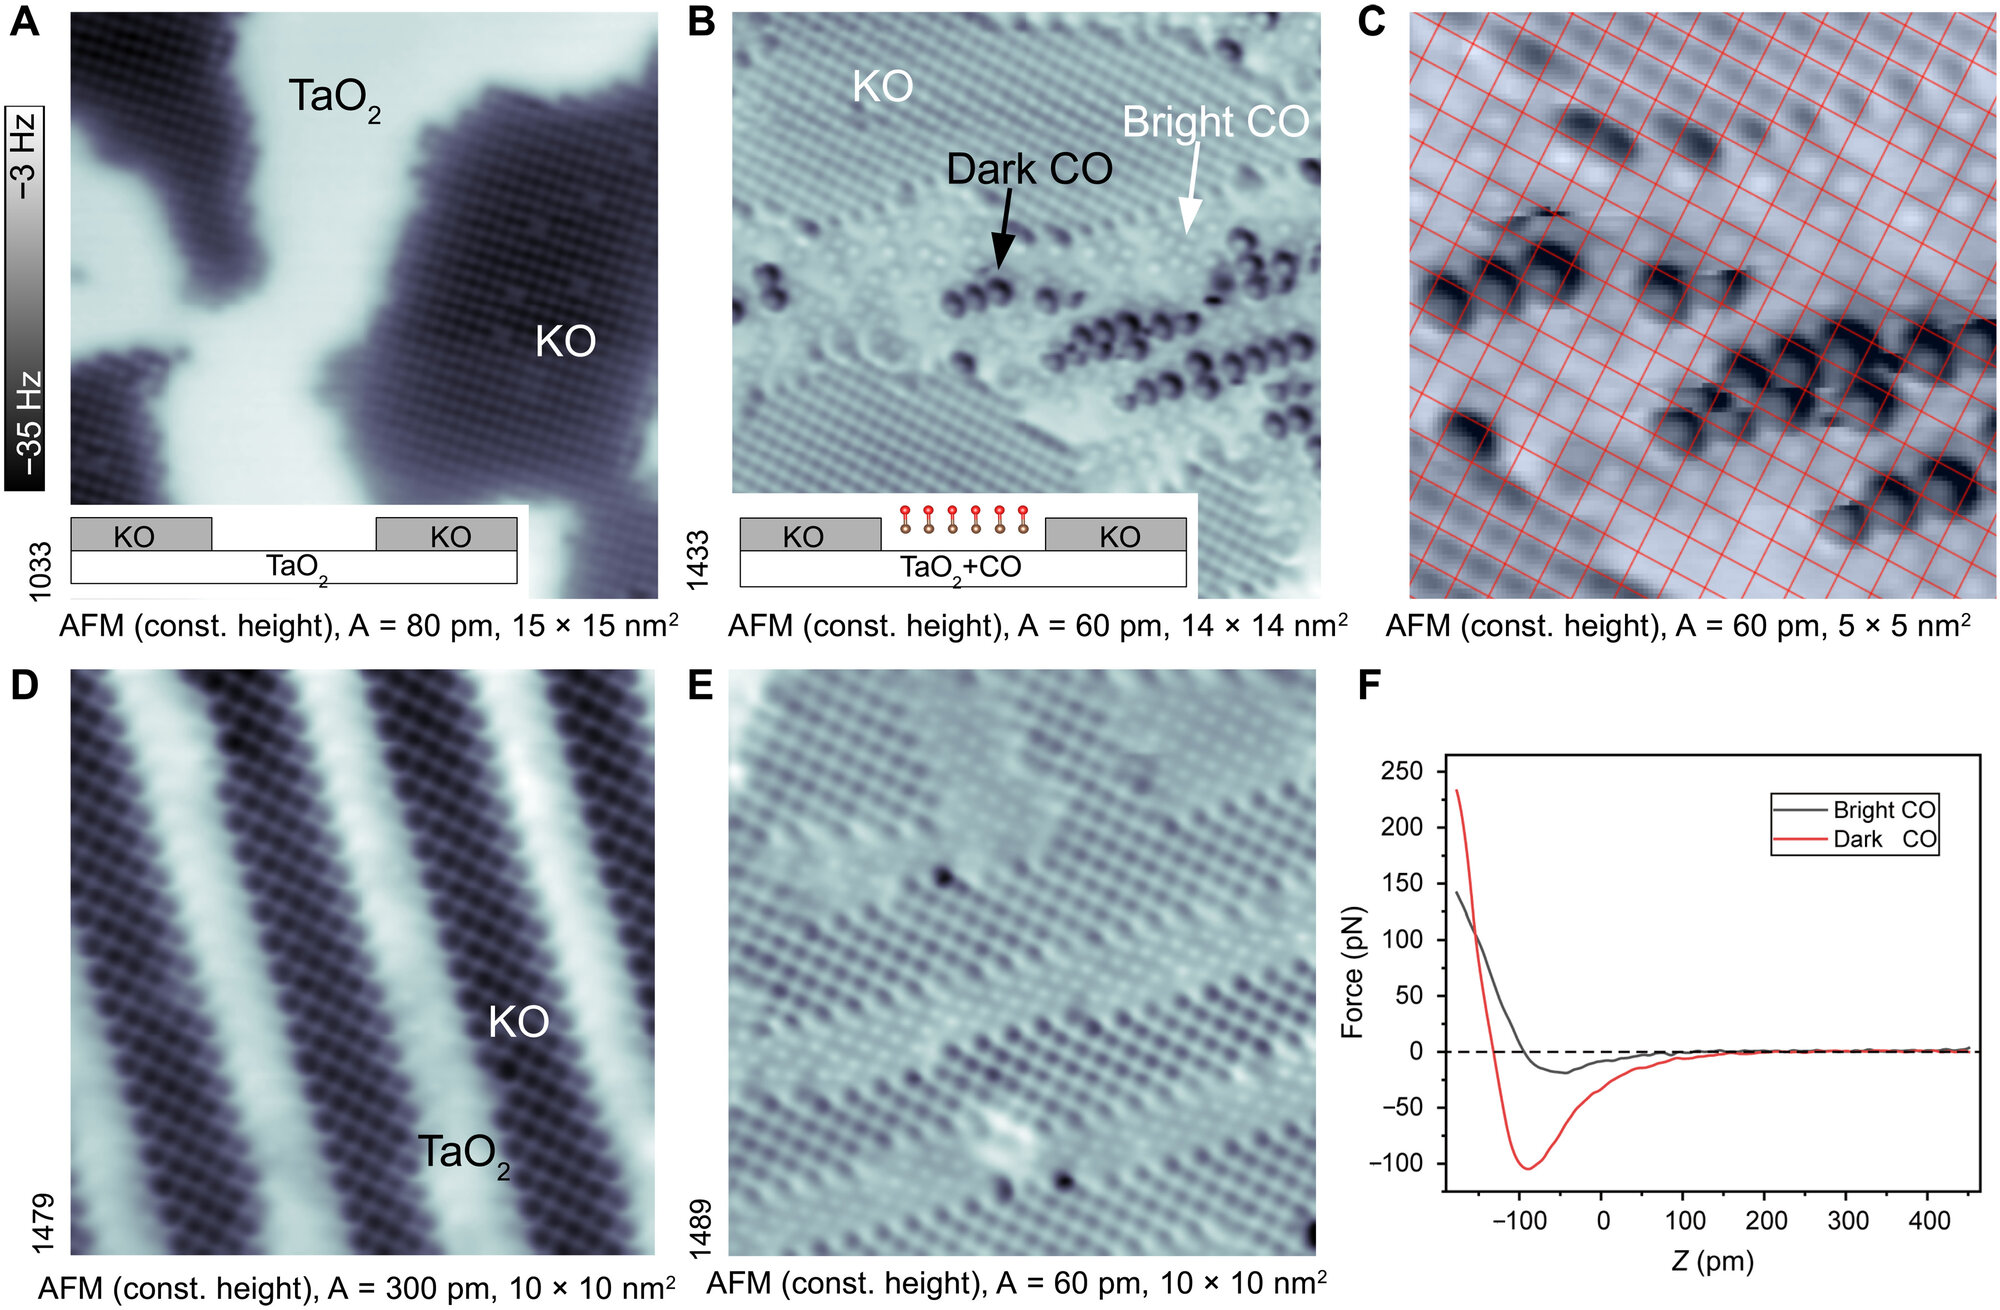
Figure Description: CO adsorption on bulk-terminated KTaO3(001). (A and B) Atomically resolved, constant-height AFM images (T = 4.8 K) of the as-cleaved surface before and after exposure to CO (dosed 1 Langmuir at 92 K), which results in CO adsorbed at the TaO2 termination. Note the two CO types: dark and bright. The insets show a schematic side view of the terrace arrangement. (C) Zoom-in AFM image with square lattice superimposed; both CO species sit at Ta sites. (D and E) AFM images of the surface, restructured to smaller, aligned terraces by annealing to 470 K (20) before and after CO adsorption, respectively. (F) Force-distance curves showing the short-range forces measured above the bright and dark CO. All images were measured at sample voltage (VS) = 0 V.
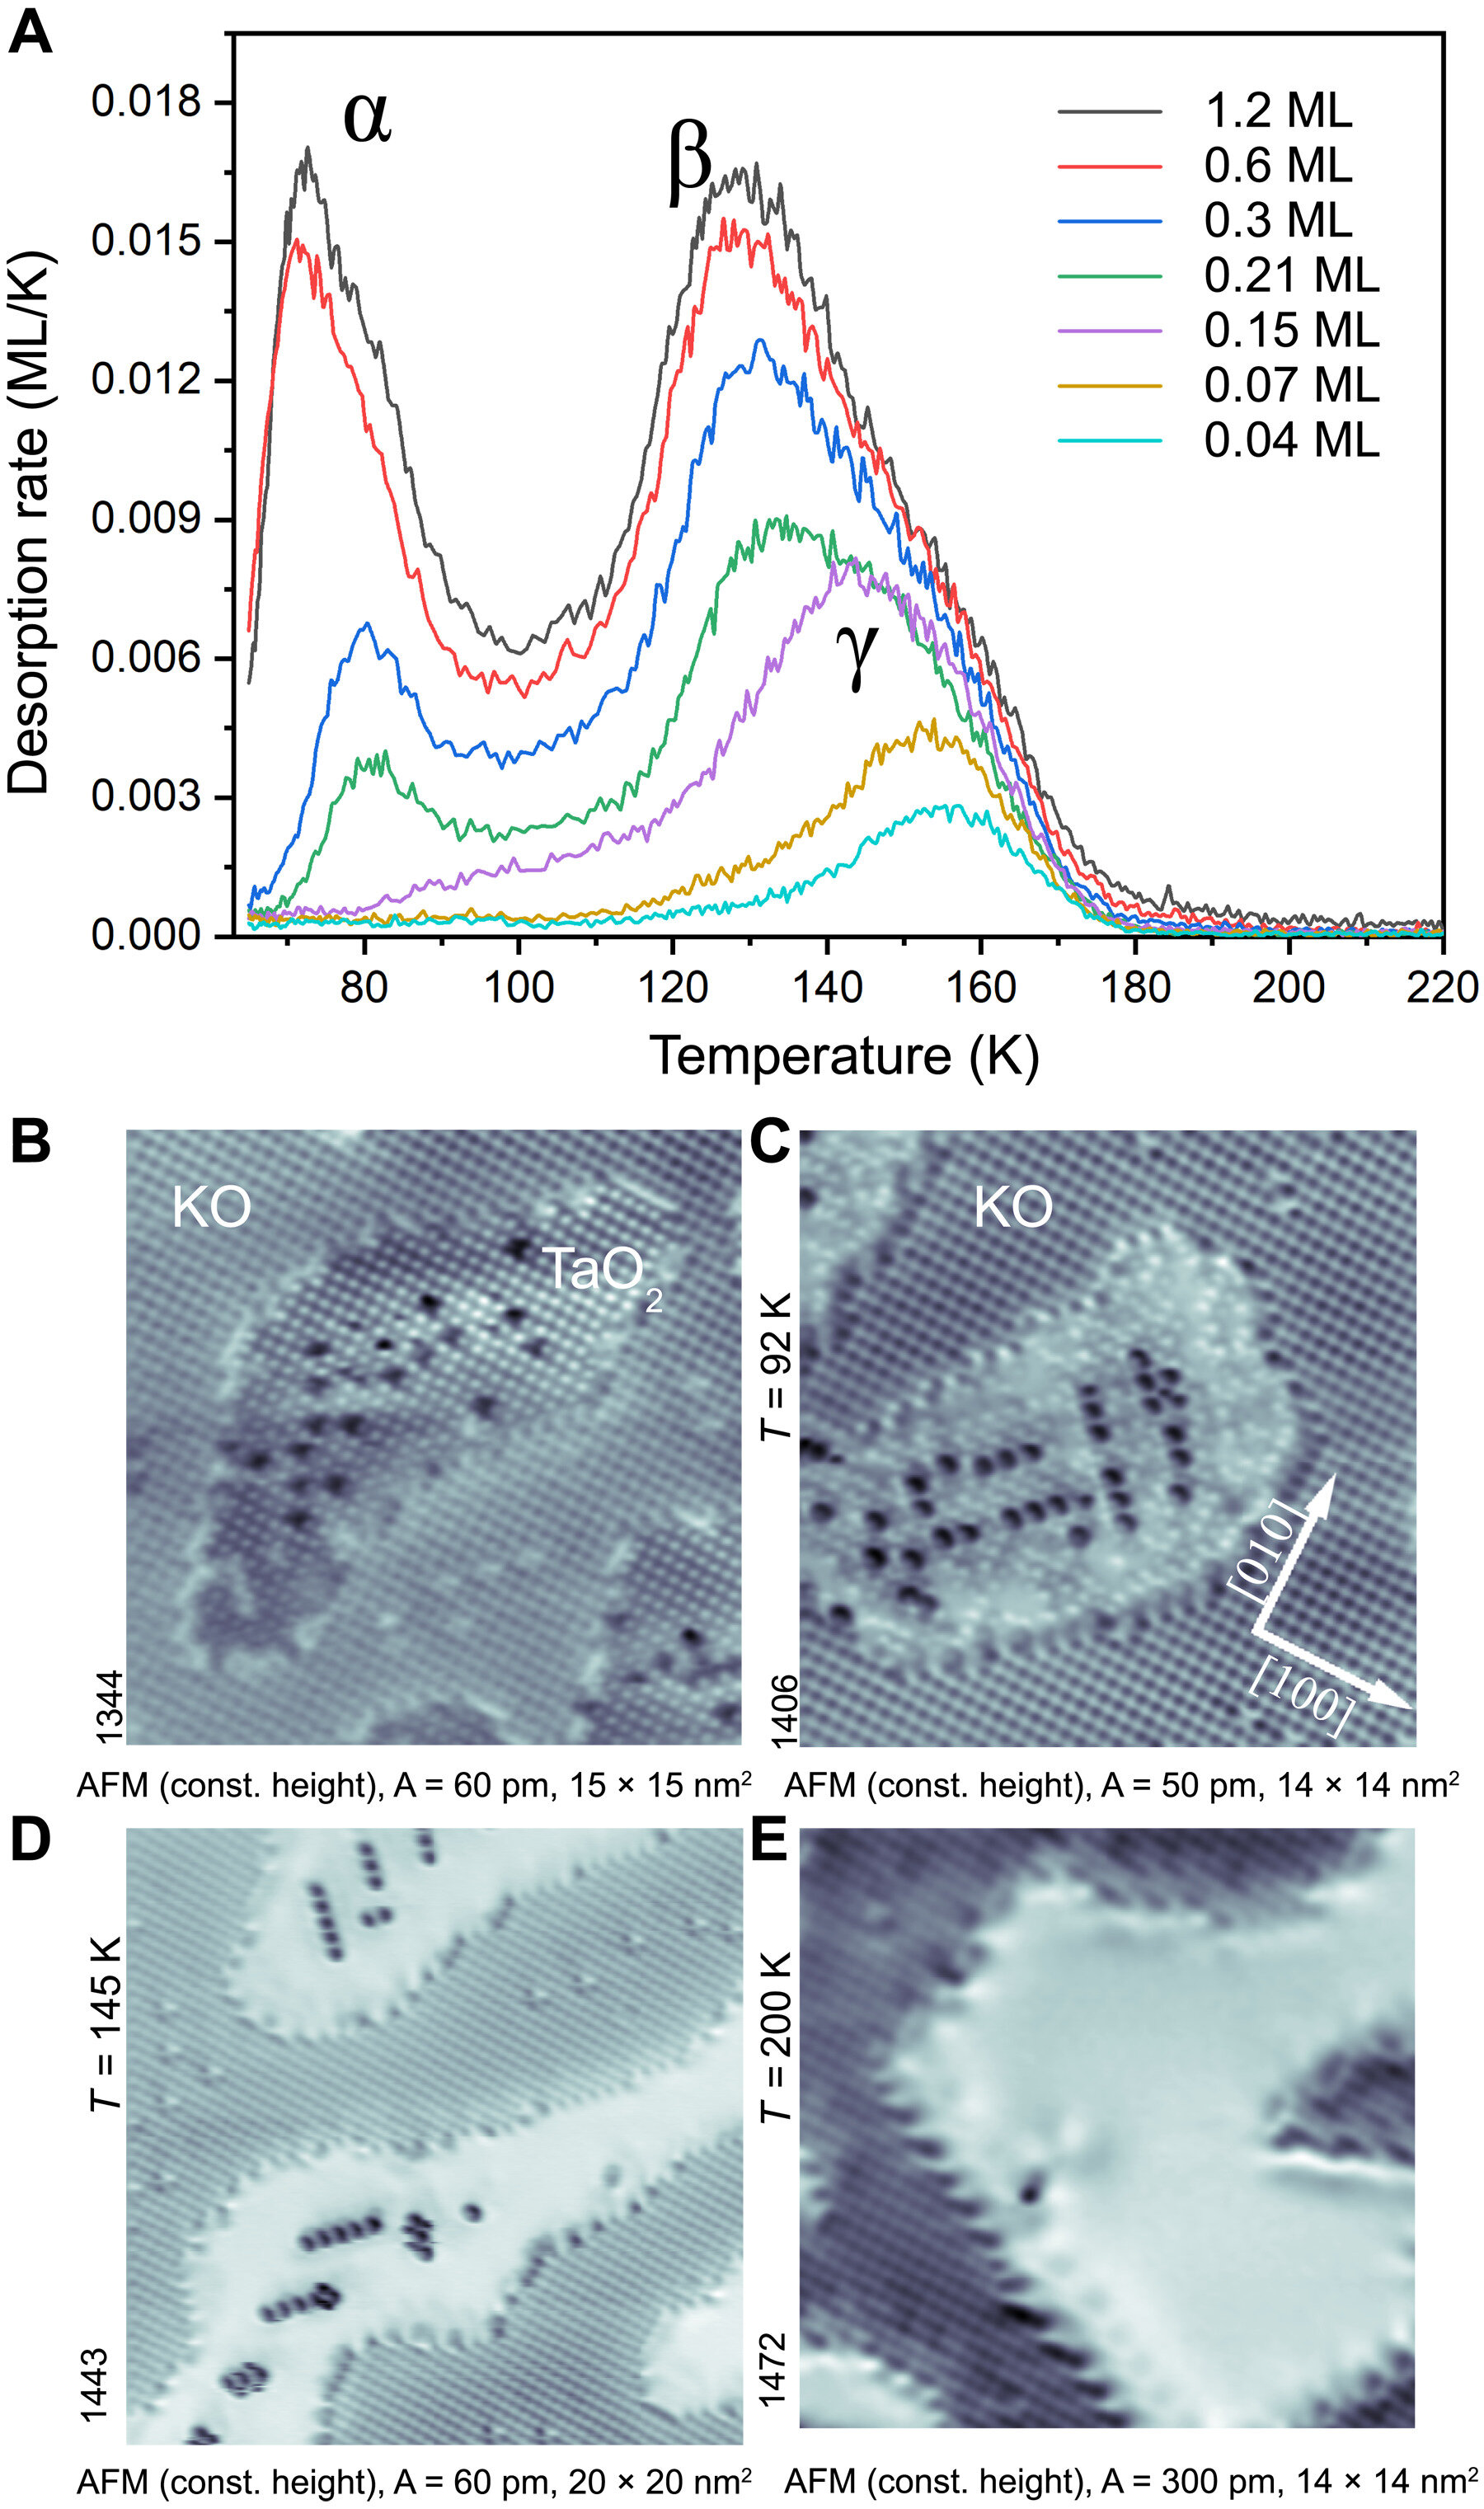
Figure Description: Desorption behavior. (A) TPD spectra of CO adsorbed on as-cleaved KTaO3(001) for various exposures, given in monolayers (ML). The three desorption peaks labeled α, β, and γ refer to CO adsorbed on KO and the bright and dark CO on TaO2, respectively. This is apparent from the AFM images in (B to E), taken at 4.8 K, after annealing the CO-covered surface to 85, 92, 145, and 200 K, respectively. Note that the CO only adsorbs on the TaO2 termination in all images. The KO terraces are clean; the bright dots are attributed to oxygen vacancies.
The AFM/STM experiments were performed at T = 4.8 K in an ultrahigh vacuum (UHV) chamber with a base pressure below 2 × 10⁻⁹ Pa, equipped with a commercial Omicron q-Plus LT head and a custom-design cryogenic preamplifier. Tuning fork sensors with a separate wire for the tunneling current were used, with a resonance frequency f0 ≈ 32 kHz and quality factor Q ≈ 20,000. Etched tungsten tips were cleaned by self-sputtering in argon gas and treated on a Cu(110) surface to ensure their metallic character. The tip was subsequently functionalized by a CO molecule on the CO-exposed KTaO3(001) surface. Short-range force-distance forces were calculated using the Sader formula after subtracting the long-range component (48). Controlled annealing of the sample was done in a manipulator, applying 10 min for equilibrating the temperatures. The quoted temperatures are accurate within ±10 K.
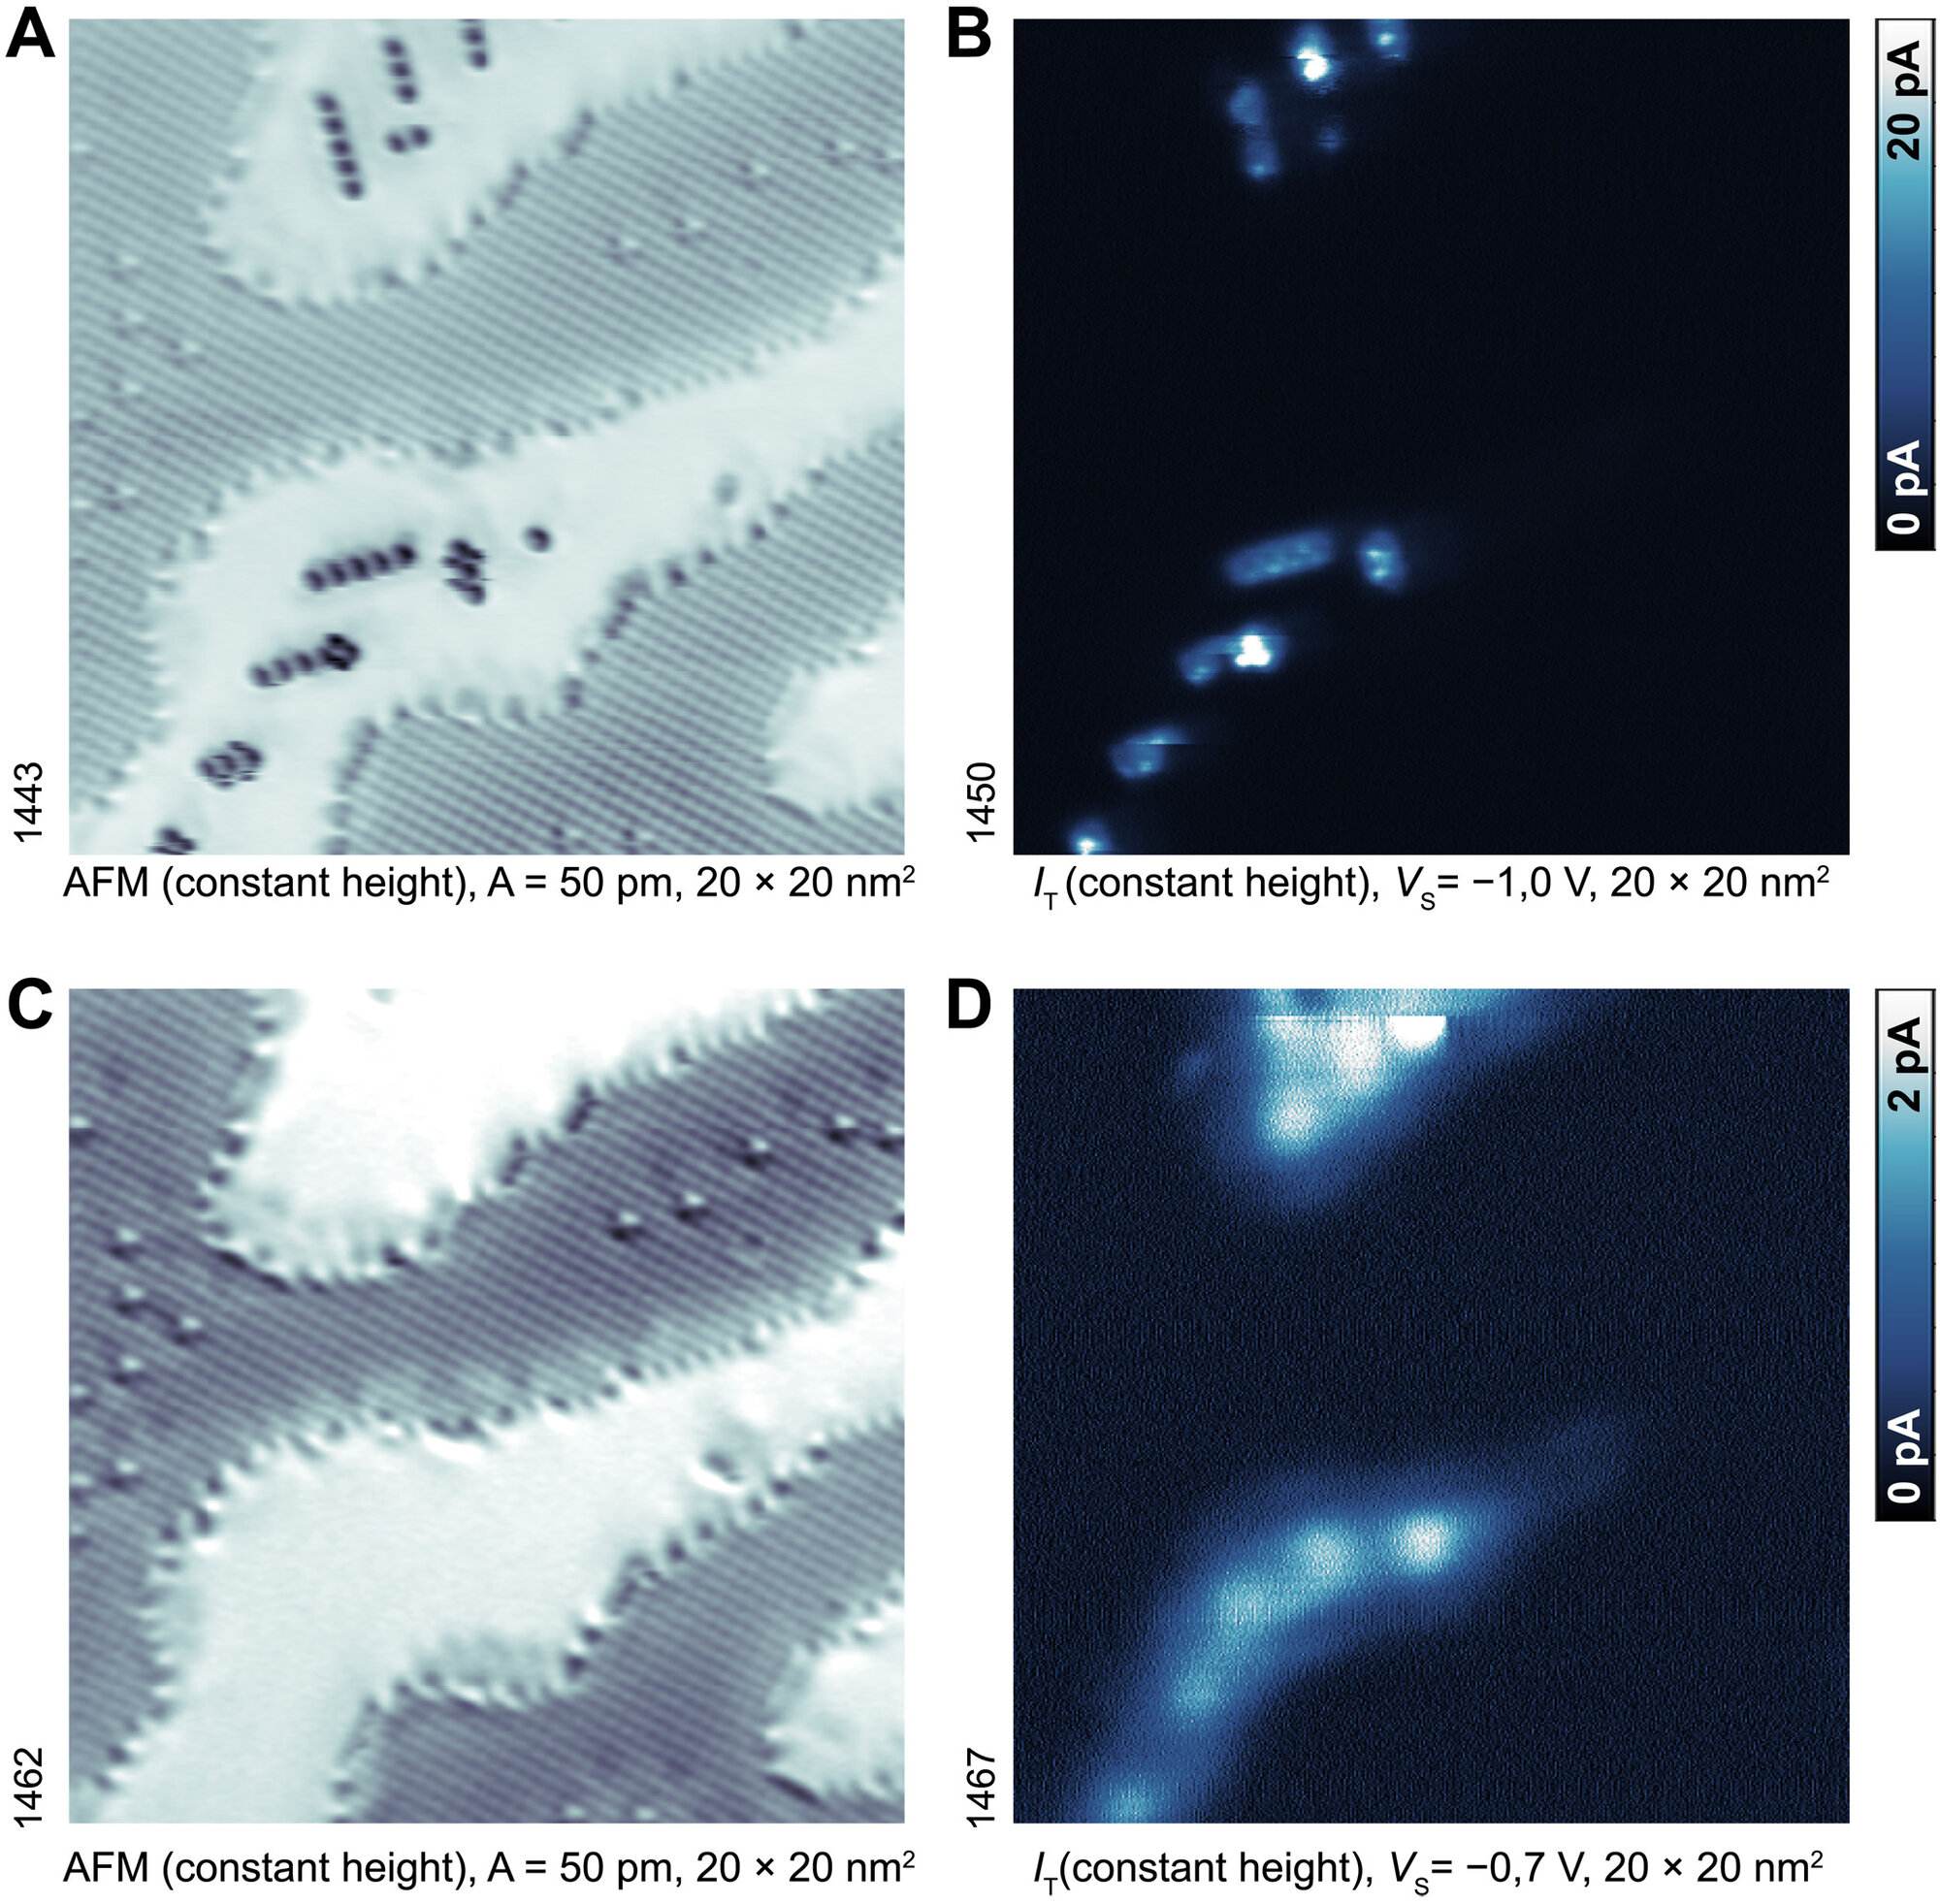
Figure Description: Charge transfer to the dark CO. (A) AFM image and (B) current image (filled states) of the surface with dark CO. (C and D) The same region after desorbing the black CO by the STM tip. All images are measured at the same tip-sample distance; frequency and current images were taken concurrently. IT, tunneling current.
--
Authors:
Zhichang Wang1,2, Michele Reticcioli3, Zdenek Jakub1, Igor Sokolović1, Matthias Meier1, Lynn A. Boatner4, Michael Schmid1, Gareth S. Parkinson1, Ulrike Diebold1, Cesare Franchini3,5*, Martin Setvin1,6
--
Institutes:
1) Institute of Applied Physics, TU Wien, Vienna, Austria.
2) State Key Laboratory for Physical Chemistry of Solid Surfaces, Collaborative Innovation Center of Chemistry for Energy Materials, and Department of Chemistry, College of Chemistry and Chemical Engineering, Xiamen University, Xiamen, China.
3) Faculty of Physics and Center for Computational Materials Science, University of Vienna, Vienna, Austria.
4) Materials Science and Technology Division, Oak Ridge National Laboratory, Oak Ridge, TN 37831, USA.
5) Dipartimento di Fisica e Astronomia, Universita di Bologna, 40127 Bologna, Italy.
6) Department of Surface and Plasma Science, Faculty of Mathematics and Physics, Charles University, 180 00 Prague 8, Czech Republic.
--
Corresponding Authors:
Cesare Franchini: cesare.franchini@univie.ac.at
Martin Setvin: martin.setvin@mff.cuni.cz