Energy Funnelling within Multichromophore Architectures Monitored with Subnanometre Resolution
Result of the Month
, under exclusive licence to Springer Nature Limited")
, under exclusive licence to Springer Nature Limited")
, under exclusive licence to Springer Nature Limited")
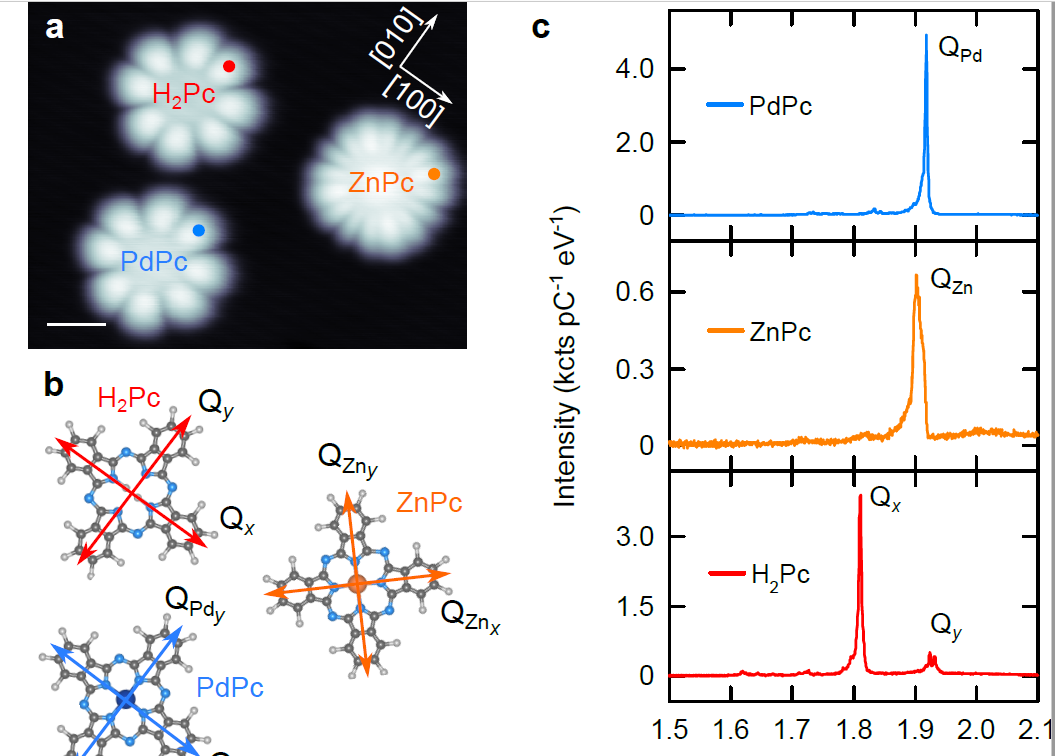
Figure 1: STM-induced fluorescence of individual chromophores. a–c, STM images (I = 10 pA and V = –2.5 V) (a), ball-and-stick models (b) and typical STML spectra (V = –2.5 V, acquisition time t = 60 s and, from top to bottom, I = 250, 50 and 50 pA, respectively) (c) of the three chromophores (PdPc, ZnPc and H2Pc) investigated in this study. The molecules are separated from the Ag(111) sample by three layers of NaCl. The spectra were recorded with the tip positioned at the extremity of a pyrrole subunit (coloured dots in a). The spectral features in c are associated to degenerate (QPd, QZn) and non-degenerate (Qx, Qy) radiative transitions of the chromophore dipoles, whose orientations are given in b. These spectra reveal a decreasing emission energy from PdPc to ZnPc to H2Pc, which therefore constitutes a model system for energy funnelling investigations. Scale bar, 1 nm
Methods
Experimental. The STM data were acquired with a low-temperature (4.5 K) Omicron set-up that operated in a ultrahigh vacuum, and was configured to detect the light emitted at the tip–sample junction. The optical detection set-up14 was composed of a spectrograph coupled to a CCD (charge-coupled device) camera providing a spectral resolution of ~1 nm. Tungsten STM tips were introduced into the sample to cover them with silver so as to tune their plasmonic response. The Ag(111) substrates were cleaned with successive sputtering and annealing cycles. Approximately 0.5 monolayers of NaCl was sublimed on Ag(111) kept at room temperature. The sample was then flash-annealed up to 370 K to obtain square domains of bi- and trilayers of NaCl. Eventually, the ZnPc, PdPc and H2Pc molecules were evaporated on the cold (~5 K) NaCl/Ag(111) sample in the STM chamber. ZnPc and H2Pc molecules were purchased from Sigma–Aldrich, whereas PdPc molecules were synthesized according to the procedure described in Lokesh and Adriaens.
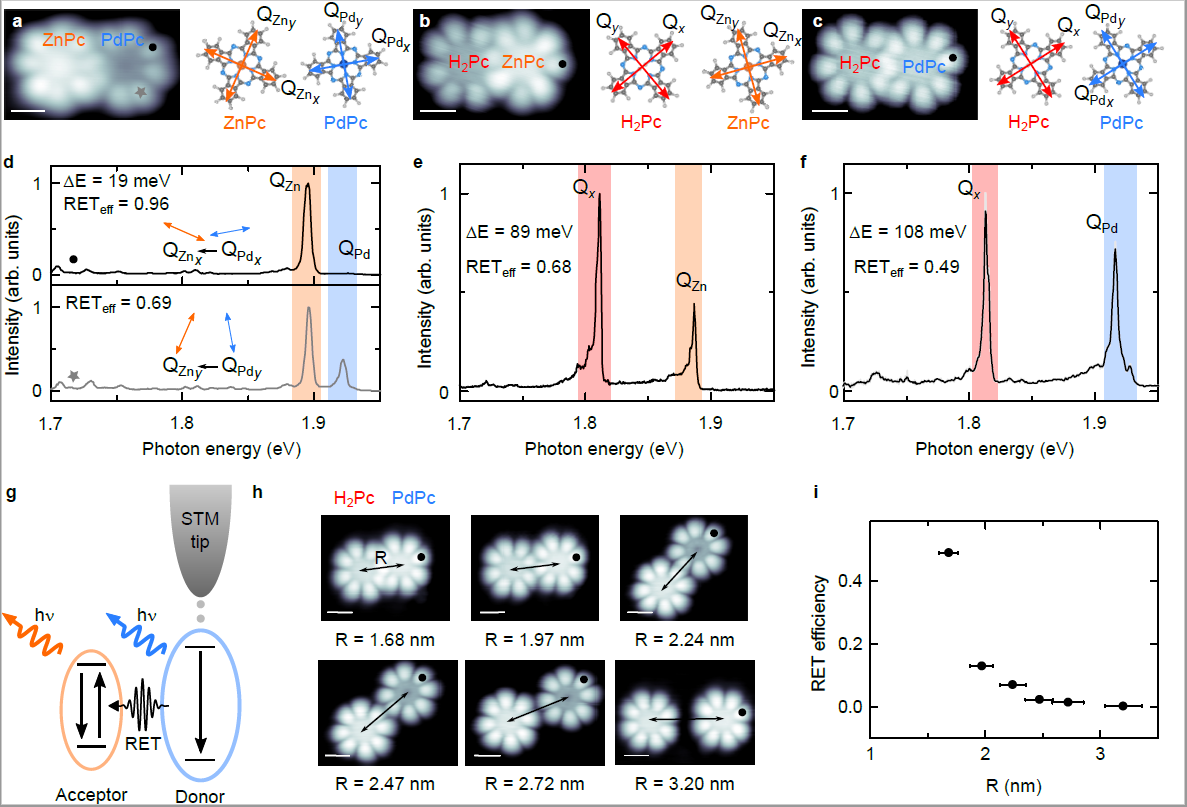
Figure 2: RET between D–A pairs. a–f, STM images (V = –2.5 V) and models of the PdPc–ZnPc (I = 10 pA) (a), ZnPc–H2Pc (I = 10 pA) (b) and PdPc–H2Pc (I = 5 pA) (c) D–A pairs, and respective plasmon-corrected STML spectra (V = –2.5 V) (d–f). The black markers (and grey star) in a–c show the STM tip positions used to record the spectra in d (I = 300 pA, t = 300 s), e (I = 300 pA, t = 180 s) and f (I = 100 pA, t = 180 s), respectively. The coloured areas in d–f indicate the spectral range considered to calculate the RETeff values. These spectra indicate that RETeff is larger when the energy difference is small between the donor and the acceptor emission lines, and when the transition dipole moments of the two chromophores are colinear. g, Sketch of the D–A energy transfer experiments. h, STM images (I = 5 pA, V = –2.5 V) of PdPc–H2Pc dimers whose centre-to-centre distance (R) is progressively increased by STM-tip manipulation (two sets of data were used to generate this panel). i, PdPc–H2Pc RETeff as a function of R deduced from the STML spectra (Extended Data Fig. 1) acquired for the STM tip positions marked by dots in h. This panel highlights the very fast RET decay with D–A separation, which suggests that the RET mechanism goes beyond simple dipole–dipole interactions. The horizontal error bars show a 5% error in the estimation of the molecule positions. The vertical error bars are smaller than the symbol size, as the statistical error on the number of photon counts is less than 3%. Scale bars, 1 nm. a.u., arbitrary units.
Additional Scientific Information
Resonant energy transfer (RET) between a donor and an acceptor chromophores depends on several parameters. Here, we treat with an STML approach the influence of the overlap between the emission energy of the donor and the absorption energy of the acceptor (Fig 2a-f), the influence of the orientation between the donor and acceptor dipoles (Fig2. d) and the influence of the donor-acceptor distance (with sub-nanometre precision) on the RET efficiency.
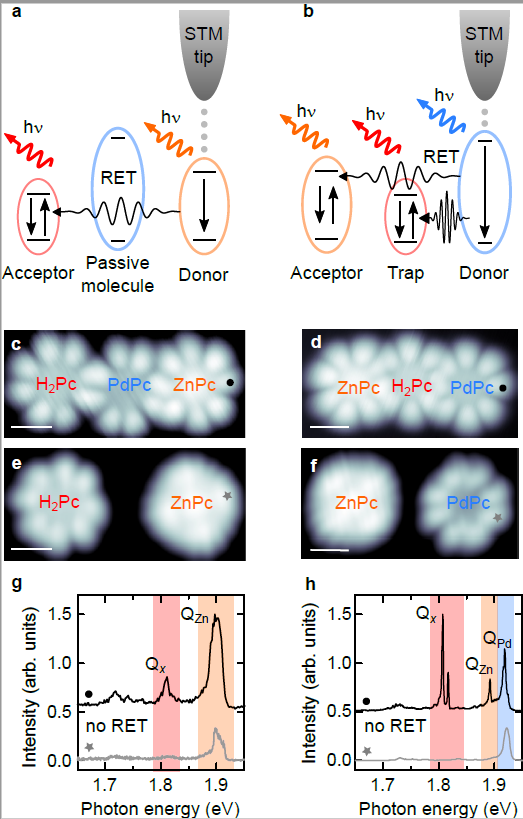
Figure 3: Promoting RET with passive and trap molecules. a,b, Sketches of the experiments in which D–A pairs were separated by high (a) or low (b) energy-gap intermediate chromophores. c–f, STM images (V = –2.5 V) of a ZnPc–PdPc–H2Pc trimer (I = 10 pA) (c), a ZnPc–H2Pc dimer separated by 3.7 nm (I = 10 pA) (e), a ZnPc–H2Pc–PdPc trimer (I = 5 pA) (d) and a ZnPc–PdPc dimer separated by 3.1 nm (I = 10 pA) (f). Scale bars, 1 nm. g,h, STML spectra (V = – 2.5 V) acquired at positions marked in c–f. I = 300 pA, t = 120 s (t = 300 s) for the black dot (grey star) in g. I = 200 pA, t = 360 s (I = 300 pA, t = 100 s) for the black dot (grey star) in h.
Additional Note
The spectra in Fig 3 g and h reveal that intermediate molecules identified as passive or ‘trap’ elements promote or modulate the RET efficiency between distant the D–A pairs, which suggests that similar elements can help direct the funnelling of energy in more complex systems.
Authors:
Shuiyan Cao, Anna Rosławska, Benjamin Doppagne, Michelangelo Romeo, Michel Féron, Frédéric Chérioux, Hervé Bulou, Fabrice Scheurer & Guillaume Schull
Institutes:
- Université de Strasbourg, CNRS, IPCMS, UMR 7504, Strasbourg, France
Shuiyan Cao, Anna Rosławska, Benjamin Doppagne, Michelangelo Romeo, Hervé Bulou, Fabrice Scheurer & Guillaume Schull
- Department of Applied Physics, Nanjing University of Aeronautics and Astronautics, Nanjing, China
Shuiyan Cao
- Université Bourgogne Franche-Comté, FEMTO-ST, UFC, CNRS, Besançon, France
Michel Féron & Frédéric Chérioux
Corresponding Authors:
- Guillaume Schull
guillaume.schull@ipcms.unistra.fr
- Anna Roslawska
- Fabrice Scheurer
Fabrice.Scheurer@ipcms.unistra.fr
Publication: Cao, S., Rosławska, A., Doppagne, B. et al. Energy funnelling within multichromophore architectures monitored with subnanometre resolution. Nat. Chem. 13, 766–770 (2021). https://doi.org/10.
© 2021, The Author(s), under exclusive licence to Springer Nature Limited