Insight into the Ehrlich–Schwoebel barrier via three-dimensional atomic force microscopy mapping of surface potentials on Au (111)
Result of the Month
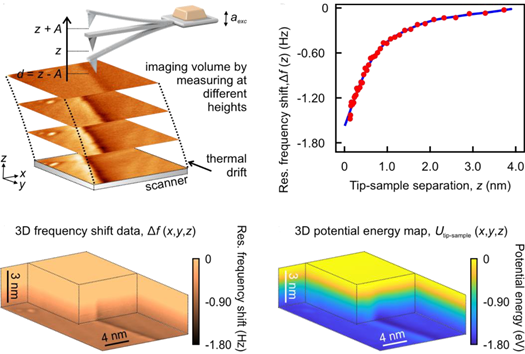
Schematic description of Frequency Modulation Atomic Force Microscopy (FM-AFM) measurements to access 3D tip-sample interaction energy data, Utip-sample (x, y, z). Multipass measurements were performed at 41 different vertical distances, z, the spacing of which was adjusted to maximize data density closer to the sample. The data are presented as a function of the closest tip-sample distance, d, which was calculated by employing the undeflected beam position and the reference scan recorded with constant current mode as the reference. Note that d is different than the piezo position, z. The oscillation amplitude, A, was kept constant by adjusting the excitation signal, aexc. The deflection signal of the oscillating sensor was demodulated as a function of the spatial position, delivering frequency shift data, Δf (x, y, z). For each lateral position (i.e., x and y coordinate), Δf (z) data were used for numerical interpolation with 512 points as a function of tip-sample separation. The resulting numerical fit of Δf (z) for each lateral coordinate was employed to reconstruct Utip-sample (x, y, z). The calculation of Utip-sample (x, y, z) enables access to the tip-sample interaction force, Ftip-sample (x, y, z), which was calculated via the negative partial derivative of Utip-sample (x, y, z) in each spatial direction. The data presented in this figure were recorded with an etched tungsten tip attached to the end of a qPlus sensor, on an atomically clean Au (111) sample.
3D-AFM measurements were performed with the Scienta Omicron INFINITY SPM System on a 200-nm Au(111) / mica sample in UHV (2 × 10⁻¹¹ mbar) at 9 K using a qPlus sensor (f₀ = 23,307.36 Hz, Q = 38,495, k ≈ 2000 N/m) operated at a peak oscillation amplitude of A = 5.0 Å. The data shown were acquired over a 14.2 × 17.7 nm² scan area.
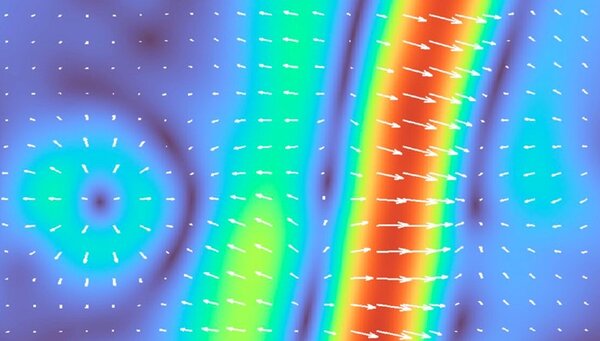
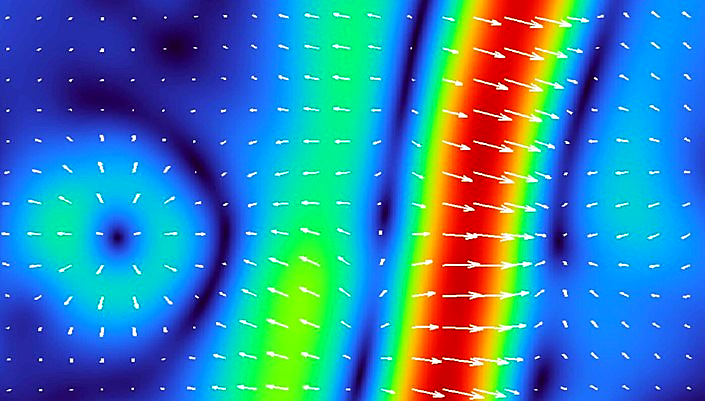
Map of the absolute lateral force, highlighting the effect of the monoatomic step edge on atoms in close proximity, acquired by 3D-AFM measurements near a monoatomic step edge on the Au (111) surface. The arrows visualize the in-plane lateral force vector field, indicating the local direction of the lateral interaction that is not captured by the magnitude map alone. Lateral forces are enhanced in magnitude near the step edges, whereby the lateral forces experienced by the AFM tip near the bottom of the step edge are noticeably higher than the lateral forces experienced near the top of the step edge. Intricate patterns of lateral forces, induced by the herringbone reconstruction and adsorbates, are additionally detected on both terraces.
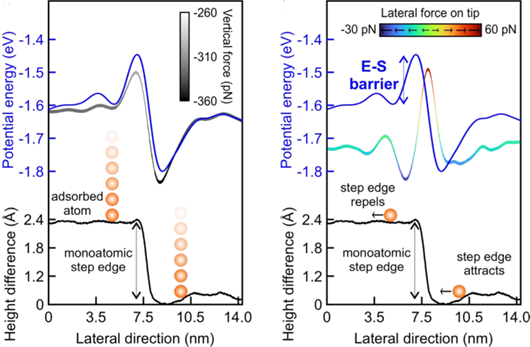
Potential energy and vertical force as a function of tip-sample distance near a monoatomic step edge on the Au (111) surface. Profiles of the potential energy across the monoatomic step edge are shown together with the corresponding vertical-force and lateral-force at the closest tip-sample distance, where representative adsorbed atoms on upper and lower terraces are illustrated with the results.