
Dichotomy in Low- and High-energy Band Renormalizations in Trilayer Nickelate La4Ni3O10: a Comparison with Cuprates
Result of the Month
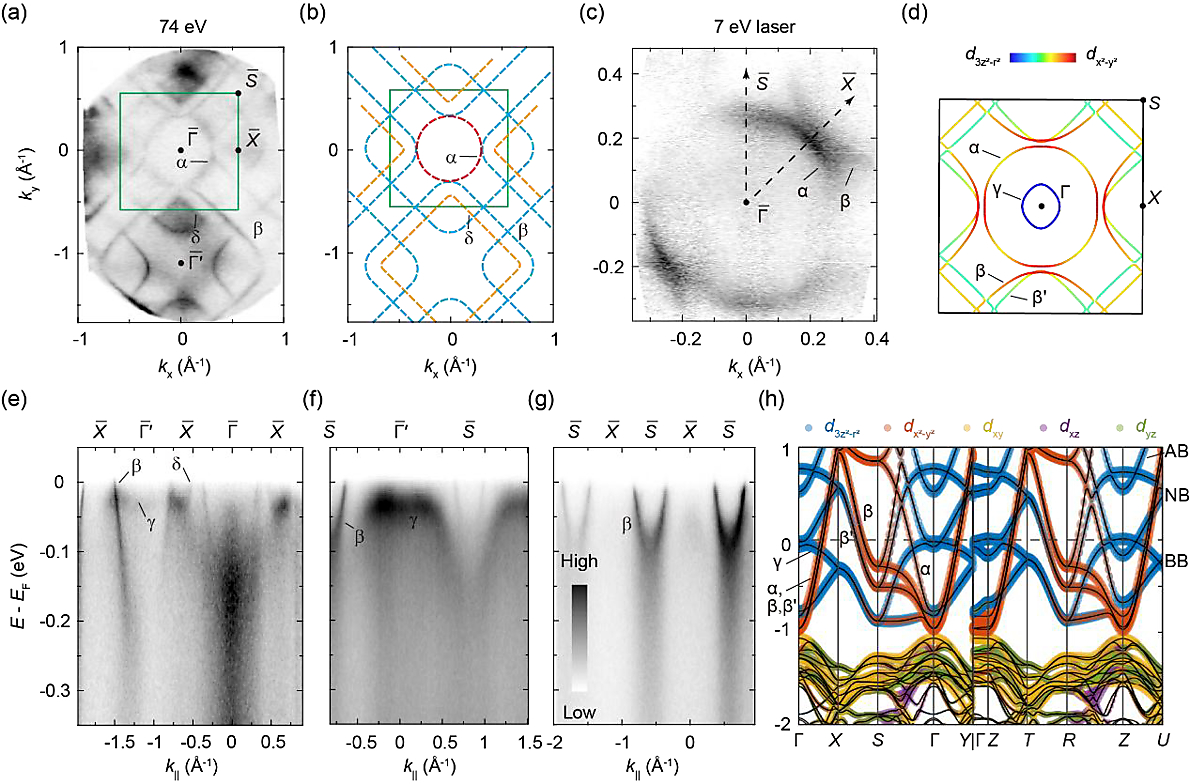
Fig. 1. Electronic structure of La4Ni3O10. (a) Experimental Fermi surface (FS) of La4Ni3O10, collected with photon energy of 74 eV. (b) Sketch of the FS as a guide of eyes for the experimental result in (a). (c) FS measured with 7-eV laser. (d) Density-functional theory calculated FS. (e-g) Band dispersions along the high-symmetry directions of Γ ̅𝑋̅ (e), Γ ̅𝑆̅ (f), and 𝑋̅𝑆̅ (g) measured at the photon energy of 98 eV (e, g) and 74 eV (f). (h) Calculated band structure projected onto different Ni 3d orbitals. Data in (c) were collected with linear-vertically (LV) polarized photons at 80 K. All other data were collected with linear-horizontally (LH) polarized photons at 20 K.
Synchrotron ARPES measurements were performed at Bloch line at MAX IV, Sweden (DA30-L analyser) and BL03U at Shanghai synchrotron (DA30). Laboratory-based laser ARPES measurements (7eV laser) were performed at Tsinghua University (DA30-L)
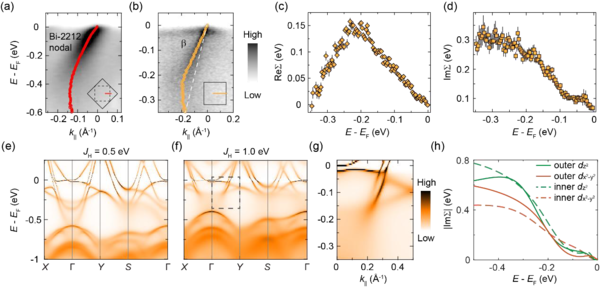
Fig. 2. High-energy band renormalization. (a, b) Spectrum of a cuprate superconductor, Bi2Sr2CaCu2O8+δ (Bi-2212) (a) and La4Ni3O10 (b), with band dispersion extracted by fitting momentum-distribution curves (MDCs) overlaid. The dashed white line in (b) indicates an assumed linear dispersion. (c) The deviation of the β band from the linear dispersion in (b), which resembles the real part of electron self-energy. (d) Imaginary part of the electron self-energy extracted from the MDC-fitting in (b). Data in (a) were measured with LH-polarized 55 eV photons at 28 K. Data in (b-d) were measured with LH polarized 98 eV photons at 20 K. (e, f) Dynamical-mean-field-theory (DMFT) calculated spectral function of La4Ni3O10 for Hund’s coupling JH = 0.5 eV (e) and JH = 1.0 eV (f). (g) Zoom-in plot in the dashed grey rectangle in (f) showing a waterfall-like structure. (h) Calculated orbital- and site- dependent self-energy with JH = 1.0 eV and Hubbard U = 4 eV.